
ECO·IN Building Demand Intelligence Platform
VEM – The “Verify” Layer
We don’t estimate savings – we verify them.
VEM (Virtual Energy Meter) is the verification layer of the ECO·IN Building Demand Intelligence Platform. It delivers metering-grade HVAC energy attribution – the precision of a meter, without installing physical metering hardware on every unit. It is not runtime calculation – it is component-level HVAC energy attribution. Runtime asks how long a unit ran. VEM shows how much energy it actually consumed, per unit, per operating state, per demand condition, every 10 seconds. It compares baseline vs actual HVAC performance and turns every operational improvement into evidence in kWh, cost, CO₂, ROI, MRV, and ESG terms.
What the VEM Layer Does
VEM turns operational action into verified evidence. It measures baseline vs actual performance, translates the result into financial and carbon terms, and produces reporting that finance, sustainability, and operations teams can trust. This is the layer that turns HVAC performance into defensible evidence.
01
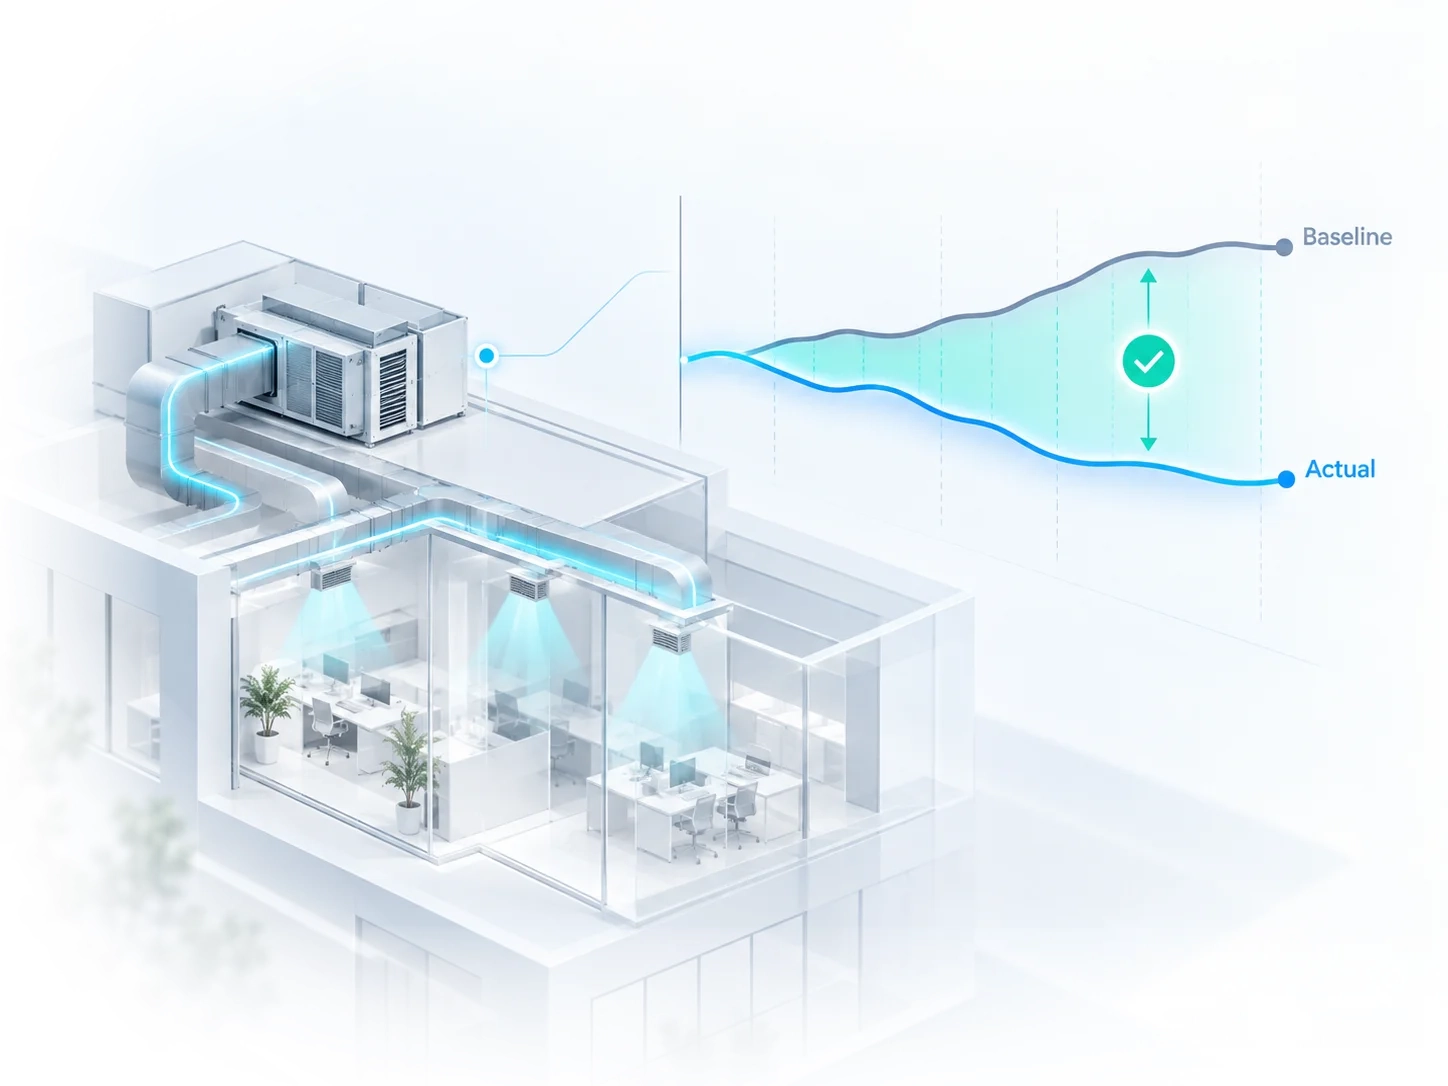
Verify baseline vs actual performance
Measure the real impact of HVAC actions against a baseline, so performance is proven in context rather than assumed from before-and-after snapshots.
02
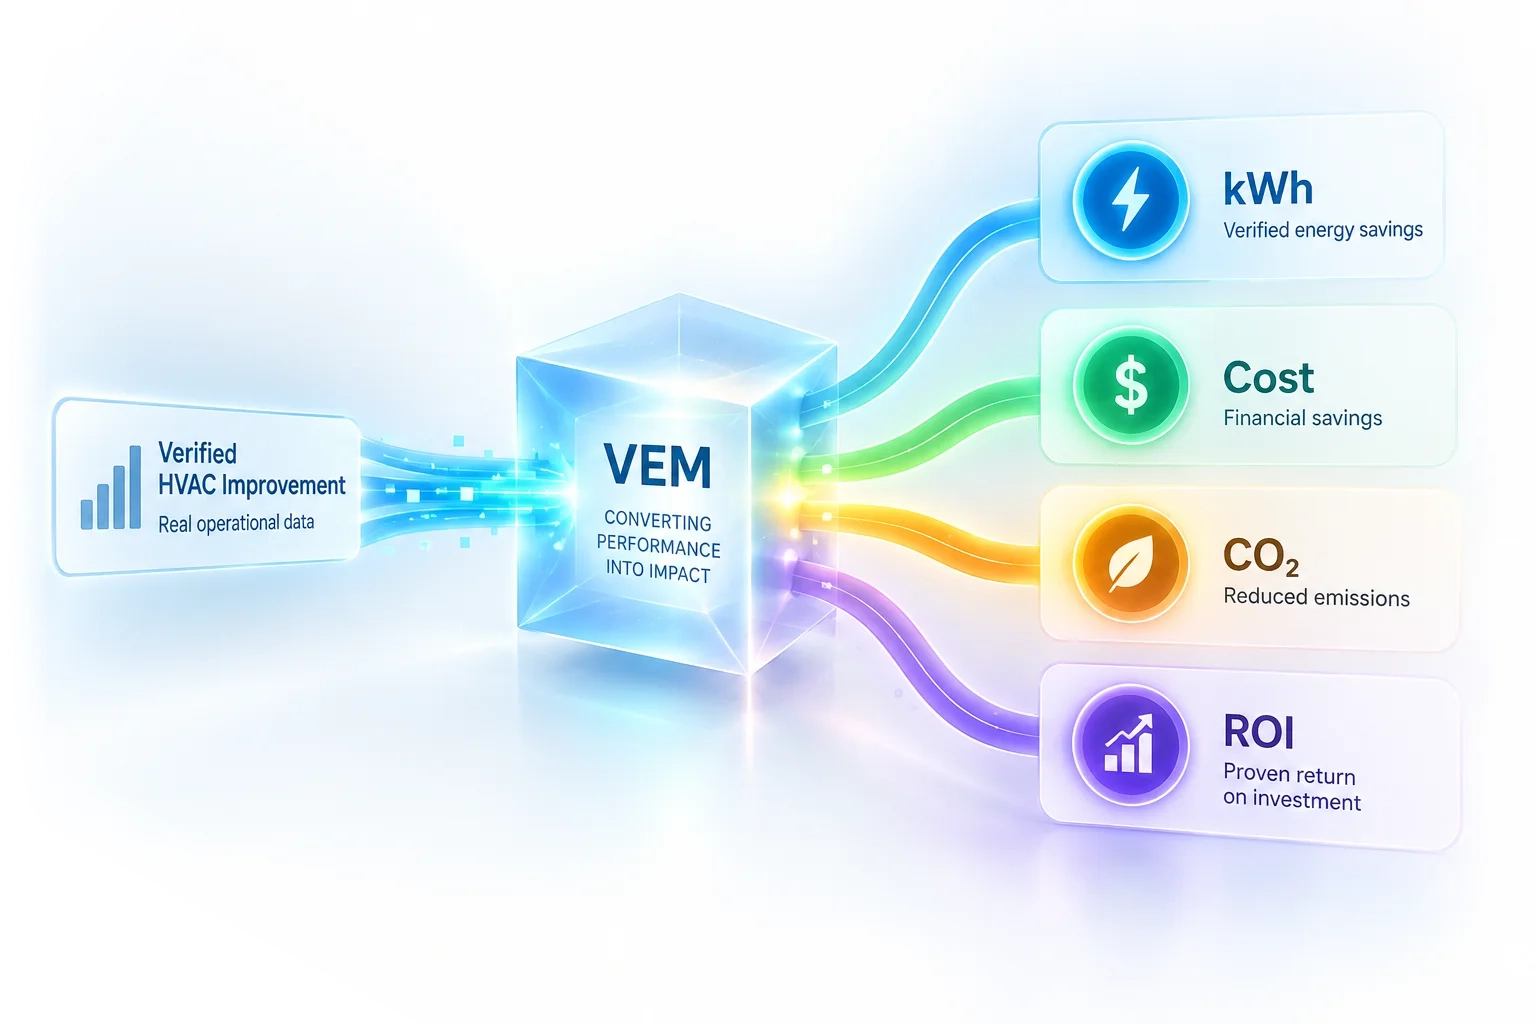
Translate savings into cost and carbon
Turn verified HVAC improvement into kWh, cost, CO₂, and ROI terms that finance and sustainability teams can actually use.
03
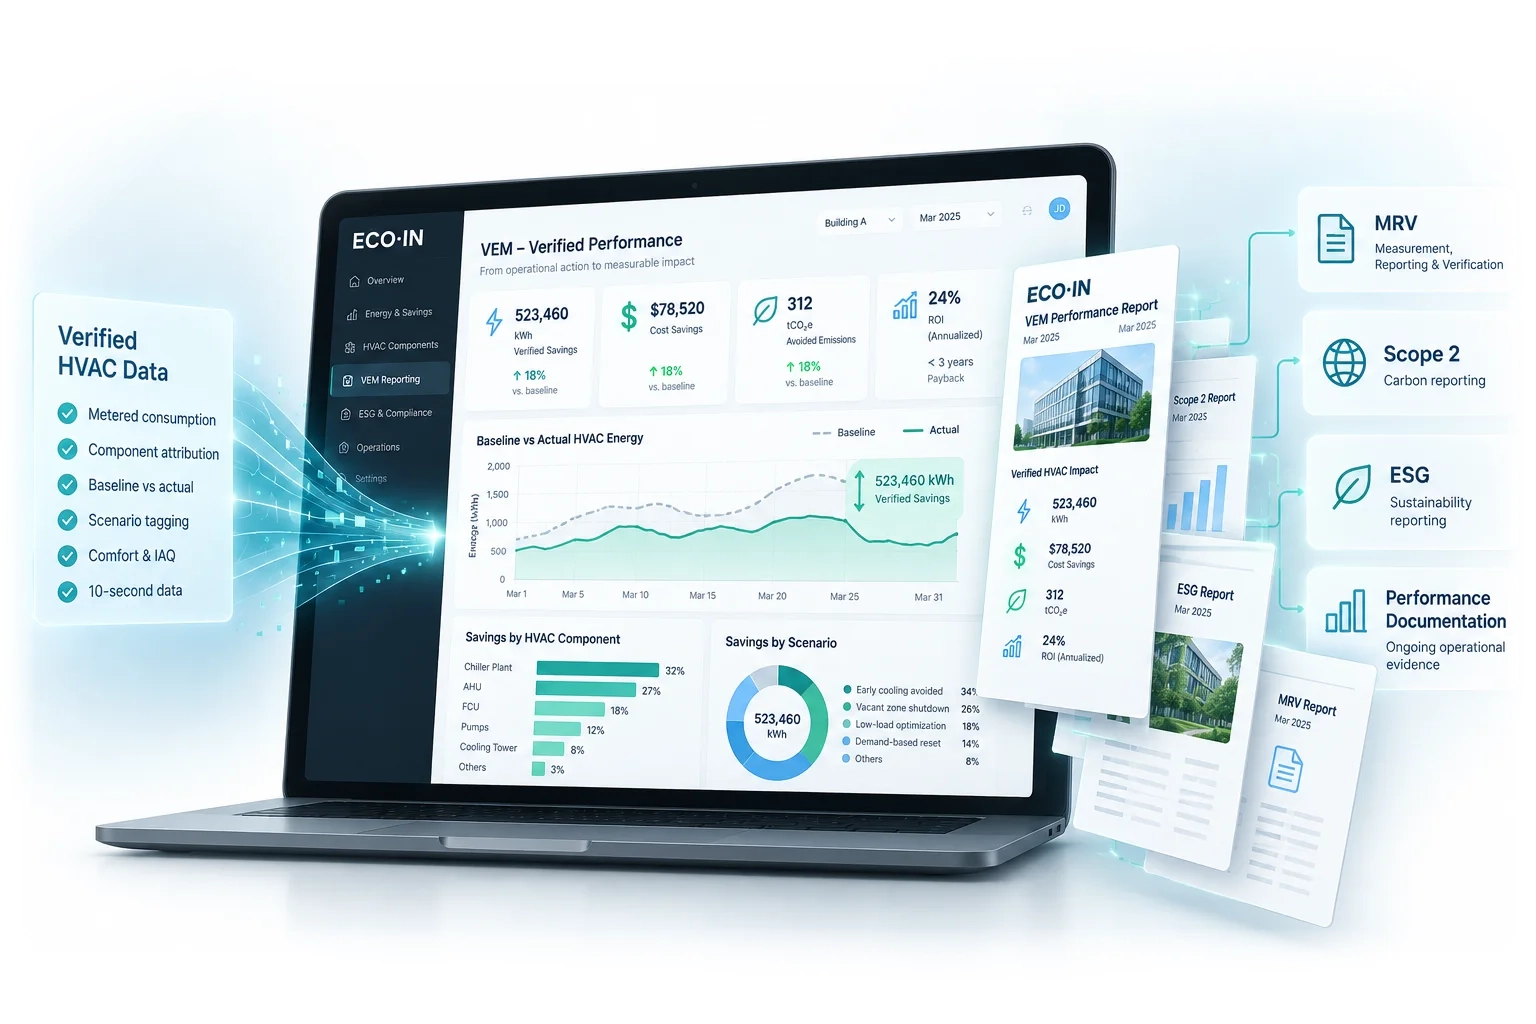
Produce structured reporting
Generate structured, repeatable output for MRV, Scope 2, ESG, and ongoing performance documentation from the same underlying verification logic.
How VEM Works – The Attribution Architecture
VEM does not estimate savings from runtime or generalized assumptions. It starts from real building consumption and uses building-specific operating fingerprints to attribute energy where it was actually used.
Real Meter Anchor
VEM always begins from the building’s actual metered consumption. It does not replace the physical meter – it starts from it.
Energy Fingerprint per Unit
During software calibration, ECO·IN builds a behavioral energy fingerprint for each AHU and FCU from weeks of real operation, using 17+ measured parameters captured every 10 seconds.
Virtual Attribution
Total metered consumption is attributed across components according to those calibrated fingerprints. No physical sub-metering on every unit is required.
Scenario Tagging
Every kWh is tagged by scenario – such as early cooling avoided, vacant zone shutdown, or low-load operation.
Baseline vs Actual
A baseline is calculated per unit and per scenario. The delta between baseline and actual becomes the verified saving.
Verification Output
The result becomes structured evidence in kWh, cost, CO₂, ROI, MRV, and ESG terms – per unit, per floor, and per building.
Core VEM Capabilities
Baseline vs Actual Verification
Verification grounded in real building behavior
VEM is built on baseline-versus-actual logic, using operational HVAC data to quantify what changed under real demand conditions. It does not treat savings as a projection or a modeled assumption. It proves whether HVAC energy was required, wasted, or saved.
Verified Savings Without Comfort Compromise
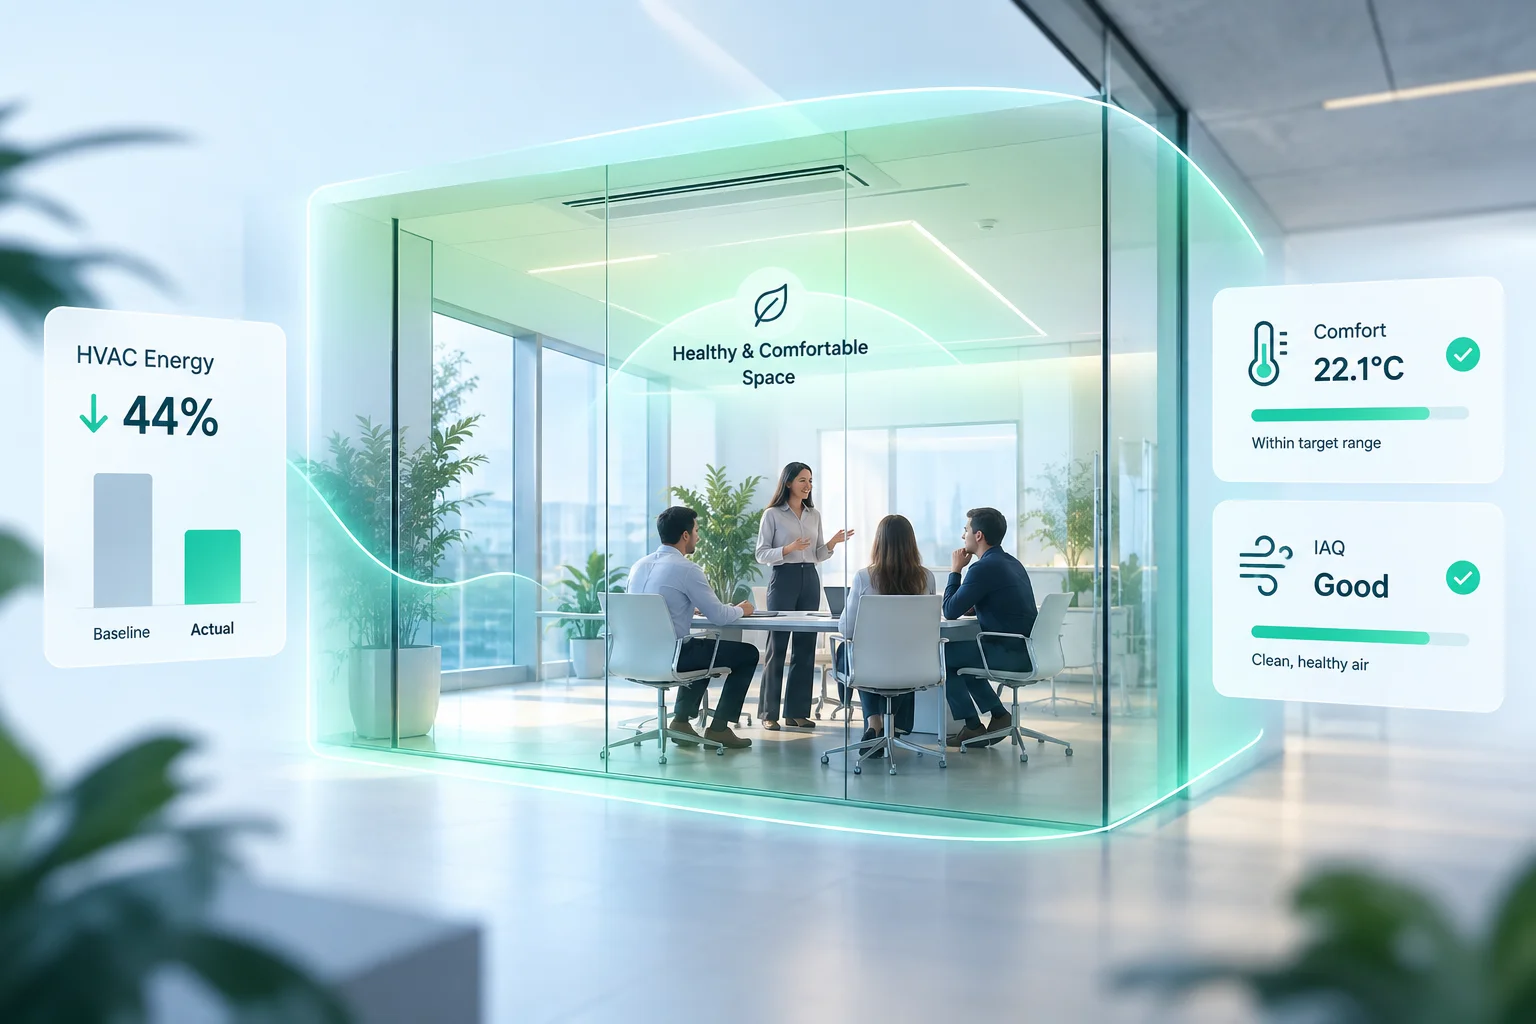
Measure comfort and IAQ alongside every kWh
VEM does not stop at proving kWh reduction. It verifies that the saving occurred while zone comfort and IAQ remained within acceptable conditions. Each verified saving is measured against the Zone Score and the IAQ state at that same moment – making it possible to show not only that energy was saved, but that it was saved responsibly.
Component-Level HVAC Evidence
Show where the impact actually happened
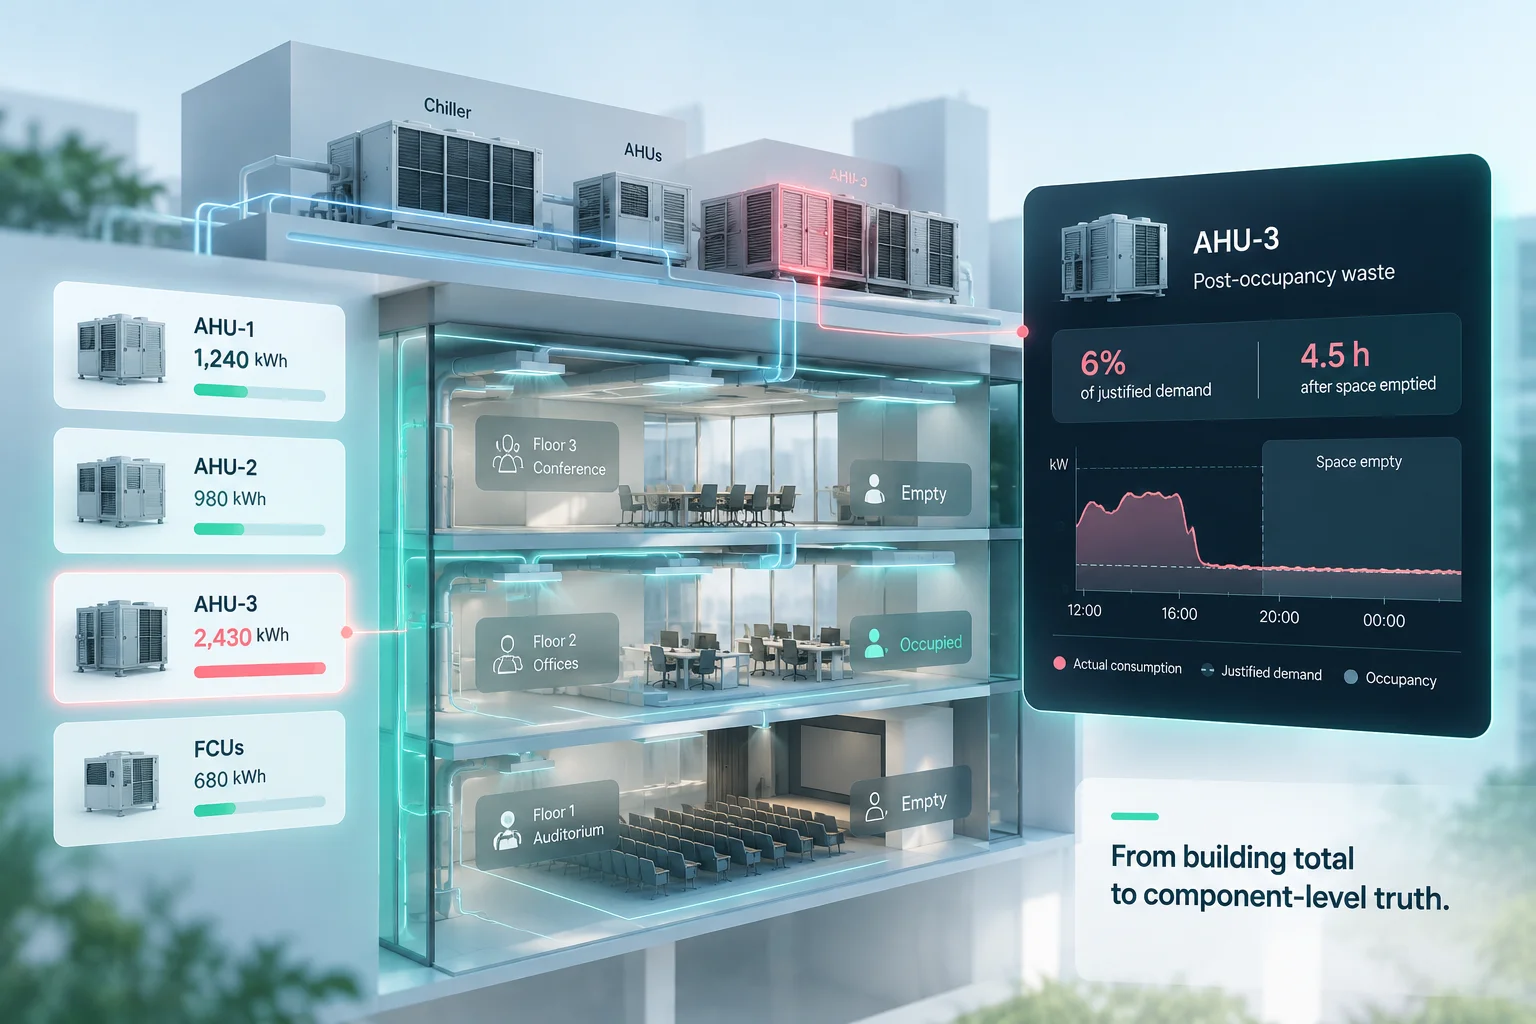
VEM links results back to HVAC behavior at component and system level. If AHU-3 runs at 6% of justified demand for 4.5 hours after the auditorium empties, that waste disappears inside the building total – but VEM attributes it to the unit, the scenario, and the time window. Because each kWh is tied to a specific unit under a specific demand condition, carbon impact can also be documented at component level, supporting Scope 2 reporting at unit level without installing a single sub-meter.
Financial & ROI Reporting
The proof finance teams need
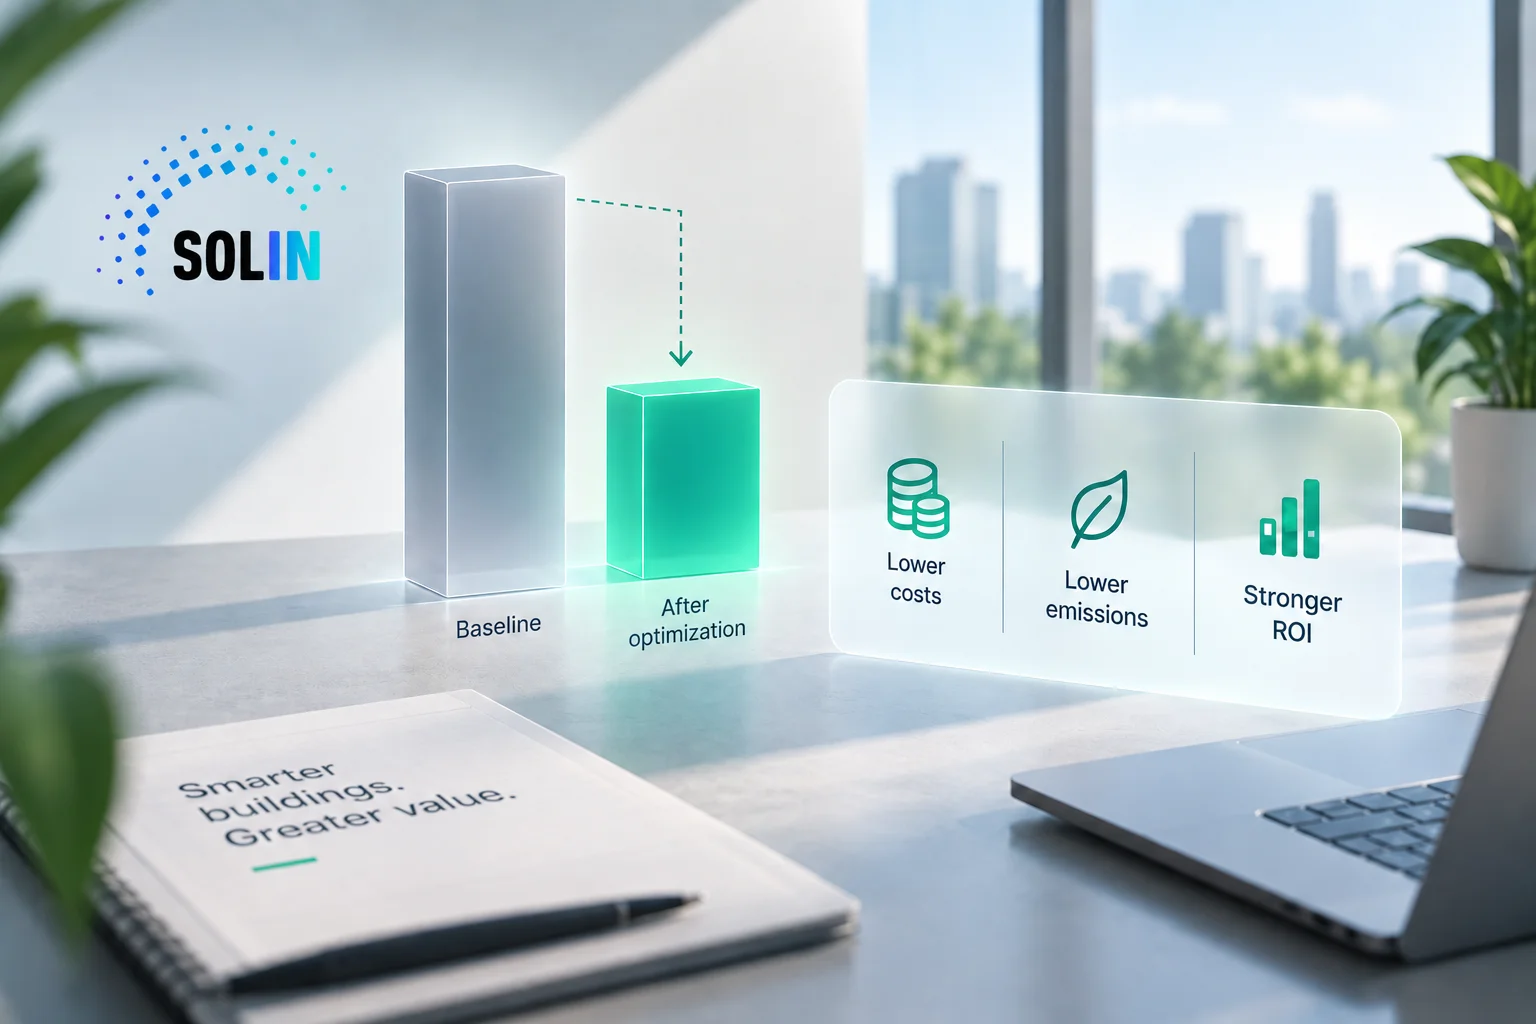
VEM turns verified performance into kWh, cost, avoided waste, ROI, and payback figures that CFOs, asset managers, and procurement teams can evaluate with confidence. In an OPEX/SaaS model, that means savings that can outweigh system cost from the first month. In a CAPEX model, it means a clear and attractive ROI based on verified operating results – not generic savings claims.
ESG, MRV & Compliance Reporting
The proof sustainability teams need
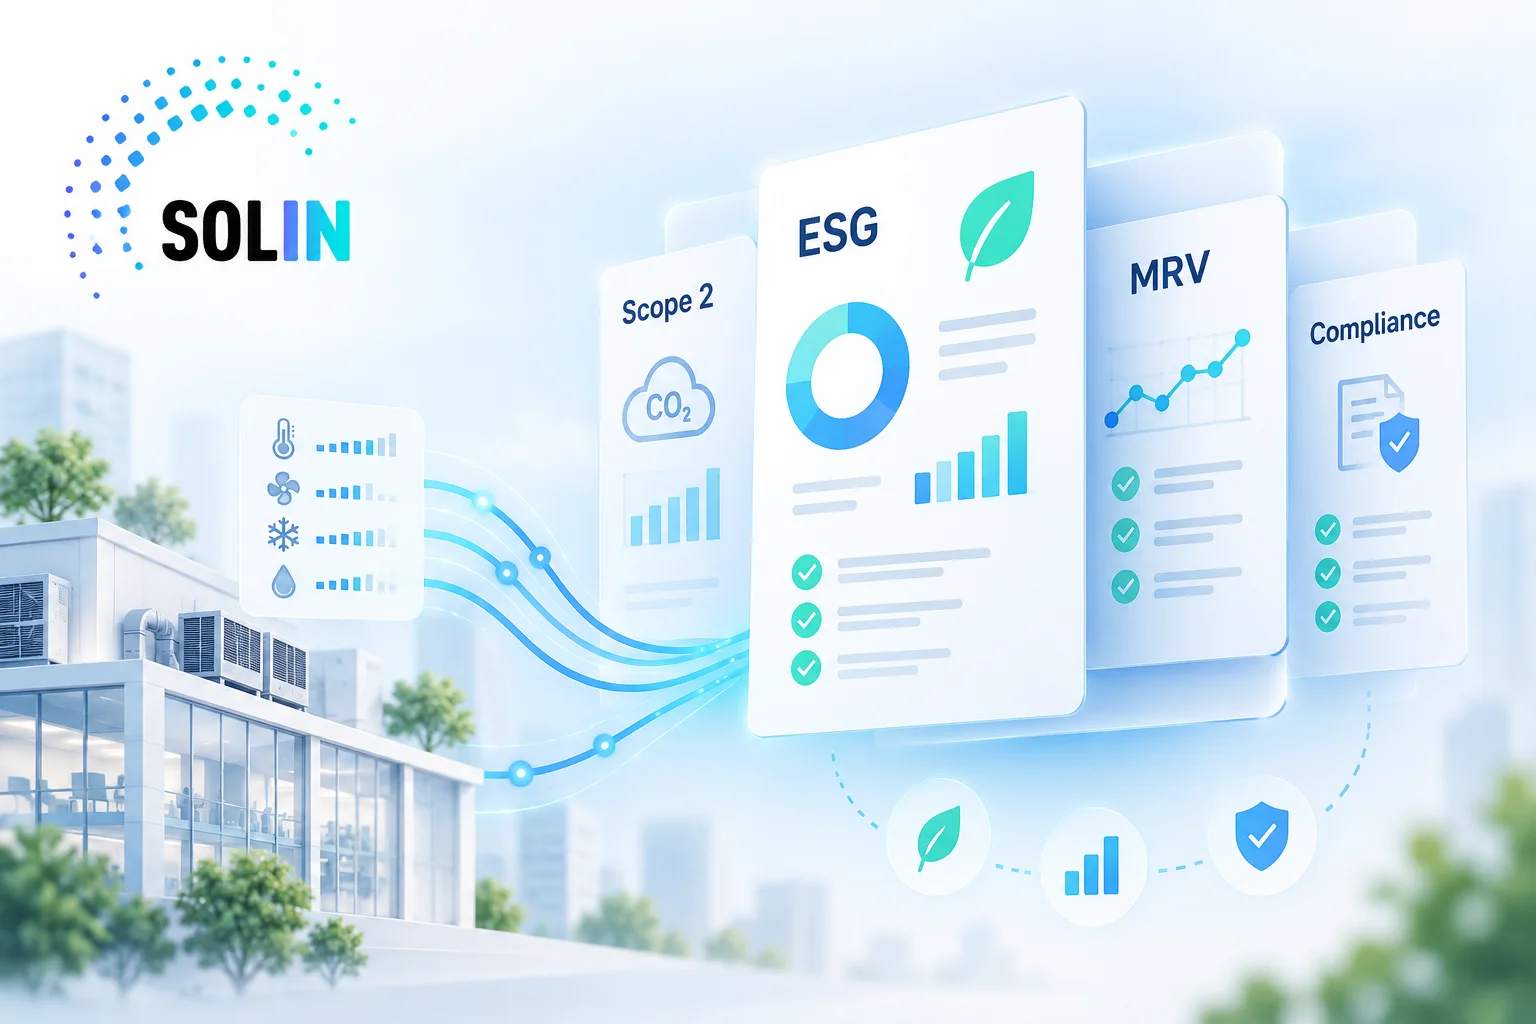
VEM generates structured monthly outputs for Scope 2, MRV, ESG, and broader reporting requirements. It helps turn operational HVAC performance into usable evidence for climate, compliance, and reporting workflows.
What VEM Reveals for the First Time
VEM does more than verify savings. It reveals operational and financial truths that standard meters, dashboards, and runtime-based systems cannot show – turning component-level HVAC attribution into decisions about waste, ROI, load distribution, and performance.
Electricity consumption per AHU and per FCU
Identify the specific units consuming materially more energy than demand conditions justify.
Thermal load distribution across chiller-served zones
See which floors or zones are receiving proportionally more cooling than occupancy and demand actually require.
Per-unit ROI and payback
Understand which AHU or FCU optimization opportunities deliver the fastest return.
Waste by component, not buried in the total
Show which units account for disproportionate waste instead of absorbing it into a total-building number.
Chilled water draw per unit vs actual thermal demand
Reveal where unit-level draw is higher than zone demand justifies.
COP at component level, not just system level
Go beyond overall plant efficiency to uncover distribution and delivery inefficiencies at unit level.
Operational Impact

Trusted savings, not assumptions
Replace projections and unverified claims with evidence that can support finance, procurement, and technical review.

Clearer finance and ESG reporting
Turn every verified HVAC improvement into cost, carbon, ROI, MRV, and reporting output from the same underlying verification layer.

Per-unit ROI and component-level waste identification
Identify the units with the fastest payback, the highest saving potential, and the clearest maintenance priority – without installing physical sub-meters on every unit.
Available as SaaS or CAPEX, with monthly savings designed to outweigh system cost from month one.
VEM supports both Energy Savings & ROI and Climate, ESG & MRV by translating verified HVAC performance into clear financial, carbon, and reporting evidence.
See how verification looks in practice
Explore a sample VEM report to see how ECO·IN translates operational improvement into verified energy, cost, and carbon evidence.
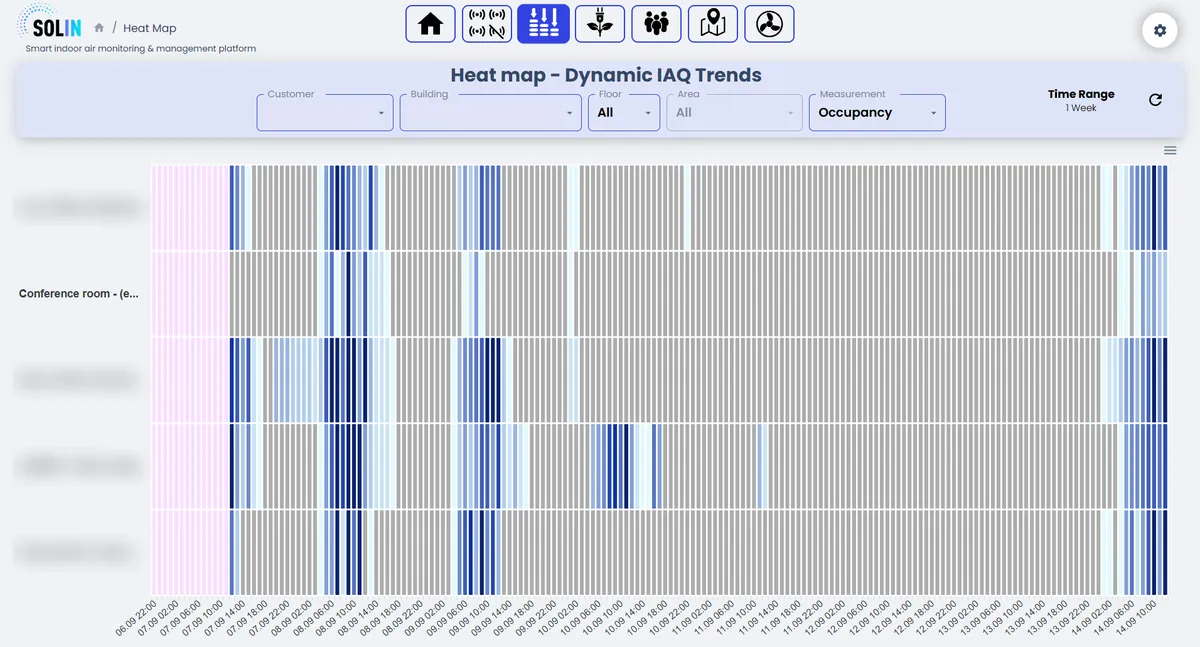
One platform. Four layers. Measurable performance.
Cut through blind spots, fixed schedules, and unverified claims with one connected system built to measure, understand, control, and verify.